Report from Agile Coach Camp Canada: Agile in Professional Services

I’m starting a delayed series of blog posts to report on my trip to the 2012 Agile Coach Camp Canada that took place in Ottawa at the end of June. In each post, I plan to cover one interesting topic or session that took place there. I want to start with Agile in Professional Services.

This session was led by Richard Gore and resulted in a lively discussion. Insights came from several different directions and I may not even remember all of them anymore.

Lean Economic Models and Real Options

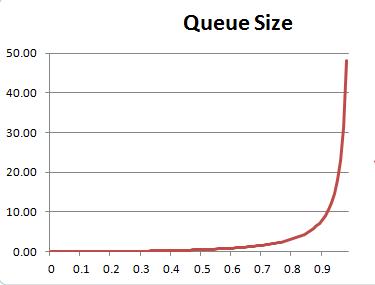
Professional services projects are especially susceptible to large transfer batches: user stories, features, smaller projects making up larger projects accumulate, then there is late integration, followed by delivery to the customer. Both customers and vendors of such projects need a serious conversation about batch sizes! “We want you to deliver this whole thing to us at the end” only reveals ignorance. “We will demo and push it every two weeks” isn’t much better. I know my audience may be getting tired of this recommendation, but Donald Reinertsen’s The Principles of Product Development Flow is a must-read. Batch sizes affect economic outcomes, so start learning about them.

One particular kind of batch transfer deserves special attention. It is the one near the end of the project Vendor’s part of the value stream, for example, from ready-to-deploy to deployed. It is a very recent insight, presented at the LSSC’12 by the German duo of Arne Roock and Markus Andrezak: avoiding a large batch transfer at that part of the value stream increases the value of the options upstream! (Links to the video of their presentation and the conference proceedings where you can find their paper). On the flip side, doing the opposite increases the project risk. Both the Vendor and the Customer are exposed to it and neither should ignore it.

Professional services projects are also susceptible to another combination of anti-patterns: converting options to obligations at the start, followed by backlog-driven development. Backlog-driven development is economically sub-optimal as demonstrated by Mike Burrows in his LSSC’12 talk (and here Reinertsen’s economic models of flow come in handy again!), but there is more. Once you’ve exercised all your options, you’re out of options and you need to replenish them. If your option-replenishment process isn’t working, it’s a serious business problem and improving the development process cannot solve it.

Design the Engagement, Not the Solution

This six-word gem uttered by Andrew Annett (and the six words included two articles) opened the door to applying our improved understanding of project economics to practical situations. The conversation between the Vendor and the Customer on how they approach building their relationship comes before the conversation about managing their project.

The two sides “should talk from the positions of equality”, “neither side should have the upper hand” and then it becomes possible for the Vendor and the Customer to have a conversation about optimal economic parameters and reducing project risk. If the Vendor is more Agile-inclined, selling Agile to the Customer as “Agile” may be counter-productive. Better present a choice between two options: low-risk and high-risk.

In the real world, the two sides are quite often not on the equal level. One of them is much more powerful and can push the other side around and shift the burden of underwriting the shared risk to them. This is an abusive relationship. Recognize it when you see it, know that that is the problem, and don’t expect Agile to solve it.


A short summary of this session could probably fit in one tweet: design the engagement, not the solution; neither side has the upper hand; lean economic models; real options.

Agile in Professional Services at Agile Coach Camp Canada 2012

Posted in conferences | 2 Comments

LSSC’12 Report Wrap-up

I wrote in my previous post that I wasn’t done yet with my LSSC’12 conference report, but I haven’t blogged in a while and it has been more than two months since the conference ended, so I guess I was done. So, this post is going to be a quick wrap-up of what I haven’t written in my previous blog posts about this conference. And those posts can be found here, here, and here.

Lean Coffee

Lean coffee is becoming increasingly popular at conferences and it was a must-do at the main lean software development conference, of course. Lean coffee is a way to moderate a meeting using a Personal Kanban board. The basic form of a lean coffee kanban board is: ready – talking about (WIP limit 1) – done. There are some nuances to moderating a lean-coffee meeting, but I’ll talk about them in a separate blog spot.

Anyway, if you showed up in the LSSC’12 cafeteria at 7:30am, one hour before the daily announcements and the keynote, you had a chance to participate in great discussions with some of the leading Lean thinkers and practitioners. By the third day of the conference, Lean Coffee expanded to four tables.

Lean coffee at LSSC'12

Lightning and Ignite Talks

Each day of the conference program allocated half-hour to six five-minute lighting or ignite talks, eighteen such talks throughout the conference. Four of the eighteen speakers were Canadian and they all hit the ball out of the park. All chose one point or story to talk about, didn’t speak too fast, trying to cram as much as possible into five minutes, and thus made their talks very clear. These four speakers were:

There were also memorable talks by Liz Keogh about complexity and The Rhythm of the Board brought from Italy by Gaetano Mazzanti – a Kanban board that plays music as cards move across it so that you can hear, not only see important patterns.


There were also great keynotes, extending the trend of inviting speakers from outside IT and software development to challenge the audience with ideas from their fields. I cannot possibly cover everything in my blog spots, so I’ll end this post with a number of useful references:

Posted in conferences | Leave a comment

Creating Options to Design the House that Jack Built

I’ve been thinking about Michael Kennedy’s LSSC’12 talk, Set-Based Decision Making – Taming System Complexity to Ensure Project Success and ways to explain it to those who weren’t there at the conference.

Housing

Kennedy’s ideas go well beyond set-based design or pursuing multiple designs guaranteeing that at least one will succeed. He identified the Wright brothers as the first (probably, unconscious) practitioners of set-based decision making. While other aspiring airplane inventors spent a lot of money following the design-build-test-repeat process, the Wright brothers did something very different: test and experiment, repeat until feasible, only then design, then build. This approach was later independently discovered and (perhaps, unconsciously) practices by many innovators in the last one hundred years – the rapid design of and the market conquest by Toyota Prius is one of the best examples.

Set-based Decision-Making = Set-based Design Multiplied by Real Options?

In set-based design, we work on two or more designs of the same product simultaneously. The date when the design must be finished is fixed and cannot be moved. We don’t know which design will succeed, but we know that one of them will.

Mary Poppendieck listens to Michael Kennedy's LSSC'12 talk on set-based decision-making

In set-based decision making, the same is done on the set of options that can be later used in designing the product. Instead of designing things, design options to design things! Instead of scheduling the date when the design must be complete, you schedule the date when the design will begin. And it begins by selecting some options from the set of feasible options and converting them into obligations. These obligations fix certain design parameters and a more deterministic design process follows, followed by building the product. The customer value is pulled through this workflow by market demand. Do not commit to any particular design options, or, in other words, don’t convert them into obligations until The Date. Once the design begins, the portfolio of options carries over to the next generation of the product.

To summarize:

Set-based design Set-based decision making
The Set designs options
The Date when the design must be complete when feasible options must exist and the design must begin
The Decision select the (most) successful design select design parameters from the set of feasible options and commit
What follows build or delivery design
Posted in hands-on | Leave a comment

LSSC’12 Report, Batch 3

I’m continuing reporting my impressions from the 2012 Lean Systems Society Conference that took place in Boston last week. The start of my report is in these two posts: Batch 1 and Batch 2.


Benjamin Mitchell: What Comes After Visualizing the Work? Conversations for Double Loop Changes in Mindset One important takeaway here was the Ladder of Inference. The five rungs of this ladder are: select, describe, explain, evaluate, propose action. A conversation of two people at the top rungs of their respective ladders of inference is basically a shouting match – they propose competing actions without understanding or discussion the underlying reasons residing on the lower rungs. It is important to keep this concept in mind, realize what you or your partner in conversation may be inferring and ask questions that help climb down the ladder to unwind disagreements.

Benjamin Mitchell

Benjamin also used several examples to reinforce double-loop learning. “Visualization alone doesn’t address systemic problems underlying people’s behaviors,” he said. He gave an example where the WIP limit was 2, but the column had 3 cards. After the limit was increased to 3, the column soon had 4 cards. Instead of teaching practices and behaviours, we need to effect changes in mindset from which the future actions will follow.

Mike Burrows: Who Moved My Risk?

Mike Burrows

Coming to this session, I was prepared to hear about using WIP limits to transfer information upstream to enable better risk management, using classes of service to manage risk, and visualizing the risk information inherent in different work item types. Mike indeed said during the session, “Making different types of work visible is the killer feature of Kanban.”

But the biggest highlight of this session for me was Mike’s inquiry into the flip side of risk — the declining ROI. Mike coined an awesome term — backlog-driven development and explored the grim economics of it. It turns out this is a classic U-curve optimization. Now, dear reader, please refer to the Principles E6 and E7 in Donald Reinertsen’s The Principles of Product Development Flow – the ROI is relatively insensitive to the backlog size near the maximum – so the conclusion is to shrink the backlog to reduce risk and improve mutual understanding.

Mike has also blogged about his session and his slides are available on Slideshare.

Markus Andrezak and Arne Roock: Are You Sure You’re Doing Project Work?

Almost immediately, Markus and Arne (both were nominated for the Brickell Key award and Arne went on to win it) presented the same U-curve analysis of the optimal batch size in projects.

"Are You Sure You're Doing Project Work?"

As you can see on the board at the start of their session, there is a large-batch transfer at the end of the project. The cards (user stories) flow pretty well through the engineering phases (development and testing) but then get bogged down in the downstream deployment steps. This is a common situation in many software development organization and was a recurring theme in the open space and many conversations in the conference lobby. The convenient approach taken by many project managers is to let work items pool in those downstream steps — we will eventually deploy all of them by the end of the project, so what difference does it make?

First, Markus and Arne debunked that “wisdom” with the U-curve batch size analysis. Second, and this was also a recurring theme in several conversations, limiting the output queue shortens the cycle time, which in turn enables better decisions on what to select into the input queue. “Output and mid-stream development queues are about doing wrong things better, but the input queue is about doing the right things right.” Markus has blogged about this session already, giving more detail and there is more about it in the conference proceedings.

I also left with the impression that the question in this session title was rhetorical and that project is really just a fancy term for a large-batch transfer to the downstream partner. Running projects this way always has an implicit assumption that the partner can ingest a batch of the certain size into their own value stream and not choke on it, but this assumption is more often false than it is true.


I am not done yet! Stay tuned for more reporting.

Posted in conferences | 4 Comments

A Digression from My LSSC’12 Report

I’m interrupting my LSSC’12 report with a short update from the real world. (The first two batches of the report are here: Batch 1 and Batch 2).


I had to submit the annual employee survey – it’s a long SurveyMonkey form organized by outside consultants so that our human resources wouldn’t know which one of the 350 employees said what. Most questions ask you to tell how you align with a certain statement – from “strongly disagree” to “strongly agree.”

The problem with this questionnaire is that it is firmly planted in single-loop learning, fixing the mindset: if only we worked the way indicated by the “strongly agree” answer, we’d be a great, customer-delighting organization. Here are four examples of questions — which I obviously left unanswered when filling out the survey — where what the “strongly agree” answer indicates is clearly not the greatest way to work.

I have easy access to documentation required to follow our processes and procedures.

This assumes the ownership of work processes and procedures is not placed with the people actually doing the work.

Career opportunities always go to the most qualified person.

I understand what is required to advance in this organization.

There is an implicit hierarchical view where “advancement” and “career opportunities” primarily mean climbing the orgchart or a “horizontal” transfer to the same functional role with a different team where “there is a better fit.” This ignores a complex, networked view of the organization and modern sophisticated models for human system design.

This organization’s performance standards ensure that we meet or exceed our customers’/clients’ expectations.

This assumes that the individual functional performance is the primary determinant of customer satisfaction – sounds like a certain discredited early XX century theory.


If you’re reading this post, there is a good chance you know me (at least virtually) thanks to the Agile or Lean community and perhaps we met last week at the LSSC. But, as one of our core values is respect human condition, I hope this is a useful reminder of life outside Seaport.


Posted in life | Leave a comment

LSSC’12 Report, Batch 2

I’m continuing to write those perishable thoughts out of my head after attending the Lean Systems Society Conference in Boston last week. Batch 1 is here, more to follow.

Again, in no particular order…


Jeff Anderson: Enabling Enterprise Kanban Transformation through Lean Startup Techniques Jeff spoke about his work at Deloitte, where he leads Agile/Kanban transformations of clients that are large, conservative, change-resistant IT organizations. The novelty of his approach (for which he was nominated for the Brickell Key award) is in the application of Lean Startup techniques to guide such transformations. The room was packed, many people stood in the room while some stood outside in the corridor.

Jeff Anderson speaking at LSSC'12

Some mental remapping of concepts is needed to understand how lean startup for change works. The transformation itself is a “startup”, the agile consultant is this startup’s “founder”/”entrepreneur”, and the change-resistant organization is complex and thus provides a lot uncertainty. Instead of laying out a plan, the consultant-entrepreneur uses the build-measure-learn loop to acquire validated learning about how the organization responds to the lean initiative. Then the innovation accounting enables him to decide whether to stick with the current plan (persevere in lean startup-speak) or change it (pivot).

Jeff and his Deloitte colleagues blogged about their work on lean startup for change for several months. But after the LSSC’12, it seems a lot of people are interested in this approach and we’ll be soon hearing about their case studies and the improvement of techniques. Follow #ls4chg hashtag on Twitter.

The slides from this session are available here.

Jeff’s Deloitte colleague Taimur Mohammad gave a lightning talk on Tuesday summarizing the lean startup for change in five minutes. And just before him, Alexis Hui spoke on Kanban as an economic bargaining system for portfolio management. To make this system function like an efficient marketplace and not like a black market, you need a scarce currency! And in an IT organization, that currency is not dollars, but the capacity of IT knowledge workers to do the work – a profound insight. Alexis’ slides can be found here.


More to come – stay tuned!

Posted in conferences | 4 Comments

LSSC’12 Report Batch 1

I came back from LSSC’12 in Boston with a lot of perishable information that I need to write down in a blog post. I am not sure about one long post actually – lets do it in small batches.

In no particular order…

Michael Kennedy: Set-Based Decision Making – Taming System Complexity to Ensure Project Success

This was a great talk by the account of everyone who was there. I saw and liked Michael Kennedy’s 45-minute Lean Kanban Benelux 2011 talk on set-based decision making, so I expected this 90-minute session to be even better. The material is a must see for anyone who wants to ever use the word set-based. Set-based decision-making is way more than set-based design or pursuing multiple options guaranteeing that at least one will be successful.

Kennedy traced the history of set-based decision-making to the invention of the airplane by the Wright brothers. Many inventors before them failed. How did they fail? They spent thousands of hours designing and building their aircraft and about five seconds testing them and the test usually resulted in a crash. The Wright brothers’s work followed a different pattern: experiment and test, repeat until feasible, only then design, then build. They conducted hundreds of experiments and when they knew flight was feasible they were able to quickly design the aircraft that would take the historic flight.

Many successful companies followed a similar approach, particularly Toyota. Toyota product development system is completely different than the Toyota Production System! As David Anderson pointed out, this is real options theory in action. By testing and experimenting, they learn what is feasible and what is not and create options. The eventual design is pulled from this set of options. This is how Toyota was able to create Lexus, which went from non-existence to dominance in two years, and later repeat the same feat with Prius. If they started designing Prius up-front – we know what would have happened by looking at their competitors.

Set-based decision-making has important implications for the software world. Simon Bennett instantly saw relevance to Enterprise Architecture.

I also have a theory that some free products that we’ve seen recently that nobody seems to have any idea how they will eventually earn revenue – Google Earth? – they’re not products themselves, but may be just public mashups of feasible options to be pulled in the future to quickly design an entirely different product when that becomes necessary – that’s how they generate economic value for the company.

Troy Magennis: Effective Modeling and Simulating Kanban Projects Using Monte Carlo Techniques

Troy gave a demonstration of his software: how you can specify an existing process, load some data, run many simulations and get the probability curve showing possible outcomes of the project. By looking at the curve and, say, the 95th percentile, we could make good project estimates. This is very compelling, but wait – there’s more.

Here is a very important insight from this session. While a project can be “run” thousands of times in Monte Carlo simulations, it is run only once in the real world. It ends up not as a probability curve, but just one spot somewhere on that curve. By simulating the project repeatedly, playing with various inputs, and feeding information into the simulator as soon as it becomes available during the project, we can identify risks early on and have a chance to address them and rewrite the project’s history. So, the simulator becomes much more important than an estimation tool.

It is fascinating that someday Monte Carlo simulations may be run as part of Continuous Integration – Monte Carlo Jenkins plug-in anyone?

This session was a great manifestation of the scientific, inquisitive, experimental mindset of the Lean-Kanban community. It also sends a not-so-subtle message to all Scrumbut and “we-do-agile-here” teams out there, getting an uncertain value from planning poker: while you are at it, your competitors may be doing Monte Carlo!


I’m approaching the end of my timebox, so thanks for reading so far and wait for Batch 2!

Posted in conferences | 7 Comments

The Elusive 20% Time

The 20% time has become popular in the software industry in recent years. Even though most programmers don’t work at companies that have 20% time, most have heard or know someone who works at a place like Google, where programmers spend 80% of their hours working on what the company requires them to do and 20% on their own projects. Or so we have been told.

A shop across town is doing it and now we want to do it too. Many programmers have tried to introduce 20% time in their workplaces and that proved to be very difficult. So, how can we do it? What are the dos and don’ts? Is there some theory behind this practice? I want to summarize answers to these questions in this post and hope programmers find it useful.

queue size as a function of utilization - rapid rise after 0.8

The main reason for 20% time is to keep capacity utilization at 80% rather than at 100%.

Amazon book cover

You can think of a software development organization as a system that turns feature requests into developed features. You can model its behaviour using queueing theory. Using queueing theory to understand how responsiveness of a software organization depends on its utilization is presented thoroughly in the Chapter 3 of Donald Reinertsen’s 2009 book, The Principles of Product Development Flow. The same logic can also be found in the popular 2006 book by Mary and Tom Poppendieck, Implementing Lean Software Development: From Concept to Cash. It has an example of how Google achieves greater effectiveness by avoiding 100% utilization. I recall having a discussion with a colleague after reading that book – Google’s effectiveness could also be due to the fact that all Googlers we both knew seemed to spend all their waking hours inside Google. We were not 100% sure about the utilization argument. But I read Reinertsen’s book later and it became abundantly clear.

So, programmers thinking of establishing 20% time need to understand the theory behind it.

Theory

If requests arrive faster than the system can service them, they queue up. When arrivals are slower, the queue size decreases. Because the arrival and service processes are random, the queue size changes randomly with time. The mathematically inclined can ask about this randomness: there must be some probability distribution, so what will the queue size be on average? Math (queueing theory) has an answer to that: if both arrival and service processes are Markov, then:

rho^2/(1-rho)

where the Greek letter rho is the utilization coefficient equal to the ratio of service and arrival rates. If the processes are non-Markov, the math is more complicated, but doesn’t change the conclusions.

If you plot this function, you can see that the average queue length remains low while utilization is up to 0.8, then rises sharply and goes to infinity. You can understand this intuitively by thinking about your computer’s CPU: when its utilization approaches 100%, the computer becomes unresponsive.

Practice

The economics of software development is such that software companies incur big costs when their queues are in high-queue states. This includes missed market opportunities, obsolete products, late projects, and waste caused by building features in anticipation of demand. The 20% time is thus the scientific answer to the problem of optimizing economic outcomes: avoid high-queue states by avoiding utilization ratios causing them. It is essentially the slack that keeps the system responsive.

Several practical conclusions follow immediately:

  • if you’re considering 20% time and doing cost accounting (developers’ time costs X, but/and the company can/cannot afford it), you’re doing it wrong. If a company can give its programmers 20% time on the basis of cost, it can afford to give them a 25% across-the-board raise. It may have some explaining to do as to why it has been underpaying them so much for so long.
  • if you’re allocating 20% to a Friday every week, you’re doing it wrong
  • if you’re setting up a 20% time project proposal submission/review/approval system, you’re doing it wrong
  • if you’re filling out timesheets, you’re doing it wrong
  • if you’re using innovation as a motivator for 20% time, you’re doing it wrong. While new products have come out of 20% projects, they were not the point. If your company cannot innovate during its core hours, that’s a problem!
  • The 20% time is not about creativity. Don’t say you’ll unleash your creativity with 20% time, ask why you’re not creative enough already during your core hours.

Those Are All Don’ts, Where Are the Dos?

You may ask now, you’ve told us all these ways to do it wrong, what about doing it right? Let me answer with the best question I’ve heard while discussing this subject: “If 20% of your capacity is mandated to be filled with non-queue items, then you’ve just shrunk your capacity to 80%, and 80% is your new 100%. Right?”

Yes, “80 is the new 100” highlights the main problem with the attempts to adopt the 20% time without understanding the theory. You need to escape the utilization trap, not to stay in the trap and allocate the 100% differently! You cannot mandate the 20% time, because you cannot choose your utilization percentage, because it’s an output variable. It is a ratio of characteristics of two processes, so it is what it is because the processes are the way they are. So you can only do it the hard way – by changing the processes: the arrival process (demand) and the service process (capability). Balancing capability and demand – we’re basically talking about a lean transformation here or building your company lean from the start. As your lean initiative progresses, slack emerges. But if try to mandate 20% time, you end up in the same utilization trap with less capacity.

Posted in hands-on | 21 Comments

The Bull’s-Eye Kanban Experiment

A couple of months ago I decided that it was time to try something different and erased my Personal Kanban board where all lines crossed each other at 90-degree angles. I thought it was time to experiment with a radically different board structure.

This is what I drew instead. (Sorry, I had to hide what was written on these stickies for confidentiality reasons, but what was written on them is beside the point.)

The sectors and sticky colours represent different types of work: administrative, coaching, maintenance and new features for a couple of products I contribute to. The centre oval is equivalent of the “Doing” column. Its size effectively sets the WIP limit, which is somewhat flexible. I usually had two or three items there, rarely one or four. The distance from the centre represents the strength of my mental attachment to a work item. Some items are outside the WIP oval, but not too far. They represent work that is coming up, that has been prioritized, that I’ve already had conversations about. This work is also limited because there is limited space between the concentric ovals. The connection weakens as we move outside the red oval. The fringes of the board (except the far right-hand side) are the backlog. These things are safely out of my mind at the moment, although they all visualize options that I can work on in the future. The stickies on the right-hand side of the board are “done.”

What Can I See On This Board?

I’m working (and keeping in mind) two main themes (blue and orange stickies). I’m actively working on two items (one of each type) and have prioritized four more (two of each kind). Additionally, a recurring task (on a green sticky) cycles in and out of the centre oval. The work is shifted towards blue and orange sectors, perhaps because I have neglected them recently – the “done” area has eight consecutive grey stickies.

This board follows two main principles of Personal Kanban – visualize and limit work-in-progress. Or maybe not, but I didn’t really care as I felt I needed to experiment with an unconventional layout. One way to think about this layout is to imagine a three-dimensional board having a conical shape. The flow is away from the cone’s base. Project it onto the base plane and you get concentric circles.

How Did It Go?

I have to admit this experiment wasn’t successful in the long run. The new board was fun at the start, but I never really a found good way to visualize recurring tasks, which was important to me. I didn’t find a good way to limit WIP effectively when a couple of recurring tasks had to cycle into the centre oval, causing some crowding.

So, here it is – try it, it might work for you. But I have already redrawn my board into something more conventional.

Posted in hands-on | 1 Comment

Personal Kanban for a School Science Project

It Started at the Library

I took my children to our city’s public library since a very young age. We visit the library at least twice a month. The library has an enclosed hall on the first floor for children of all ages. Up until a certain age, we just played toys here, read some toddler books and picked DVDs with movies about Dora, Diego and Bob the Builder.

Before her seventh birthday, Sasha had read all Jack and Annie books and started exploring other shelves. She soon found her favourite shelf. It was filled with books about ancient civilizations: Egypt, China, Rome. But Greece was her favourite. Almost every week she would take home several books about Ancient Greece and read them cover-to-cover.

The School Science Fair

When the school announced a science fair, open to students from Grade 2 to Grade 6, our second-grader already knew the topic of her project. I helped her with some simple computer tasks and — ha-ha — as a process consultant. I just had to remember not to overdo it.

The Kanban System

We mapped a very simple value stream. The end of it when a topic is fully implemented: written, drawn, printed and glued to the 4-by-6 project board in the right place. There is nothing left to do with it. Sasha’s backlog contained about a dozen such topics.

kanban board

The “Doing Now” column (actually a row, as the flow was from top to bottom) had a WIP limit of two. We worked on no more that two items at once. When a topic was written, drawn or printed and all the paper was cut, it was ready to be glued to the board. The “ready to glue” buffer had a limit of four. We wanted to have options before deciding to glue something to the project board, a decision that was hard to undo. At the same time, the total work in progress in the system wasn’t too high, so we wouldn’t start new work before getting feedback from how some of the first topics looked on the actual board.

Win-win-win-win

The project was finished on time. The child never stayed up late to work on it. The parents never did any work on it after the child was in bed, staying up until midnight trying to finish it. There were never any tears or fear of embarrassment. Sasha’s project was a hit. There was sanity in our home while she worked on it. And my wife and I quietly took some pride in the fact that while many bigger kids brought physics and chemistry projects to the fair were clearly done with a significant push from their parents, Daily Life in Ancient Greece was purely the work of our seven-year-old child’s mind.

school project on a 4-by-6 cardboard

Posted in hands-on | 4 Comments