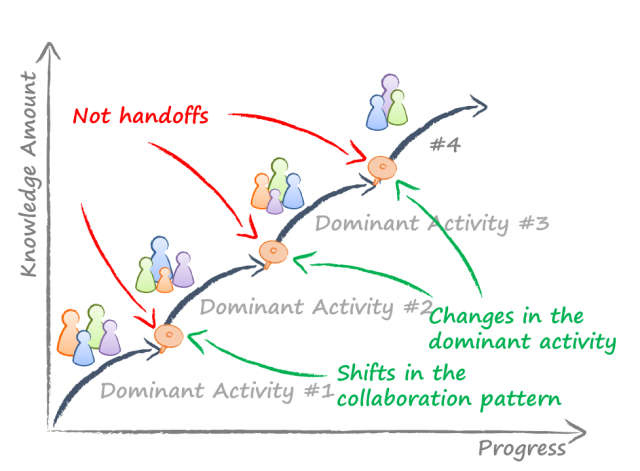
It occurred to me during a recent training class to make a small, but important change to my Knowledge Discovery Process diagram.
Please refer to this old, popular post from two and a half years ago – Understanding Your Process as Collaborative Knowledge Discovery — for the background and summary of the knowledge discovery process concept we use in the workflow visualization practice of the Kanban method.
As a very brief summary of this concept, we try to visualize the process by paying particular attention to information arrival and discovery. The process begins from a relatively poor state of knowledge that enriches as we approach the downstream delivery point (hence the German translation: Bereicherungsprozess). We see this accumulation of knowledge as a series of dominant activities punctuated by shifts in activity or collaboration pattern.
What’s the problem? The horizontal axis label was “time” in my original knowledge discovery process diagram because I couldn’t think of anything better. (Actually, the “original” drawing improved and replaced the S-curve visualization that I used for two and a half years before that while searching for better ways to communicate the concept visually.) When teaching the concept, I always took care to explain that the horizontal axis is not linear, that is, equal horizontal segments on the chart don’t mean equal time intervals. There was also no assumption that the activities take equal, comparable or deterministic times. I was also aware that using calendar time on the horizontal axis was a great way to hide queues in the process (this is the fatal flaw of Gantt charts – one of the insights from Don Reinertsen’s Lean Product Development 2nd Generation workshop).
Then it occurred to me during a recent training class that I can simply relabel the horizontal axis as “progress.” This training class followed my reading of Walter Isaacson’s biography of Benjamin Franklin where the title of one of the chapters was “A Pilgrim’s Progress.”
This solves the problem. Points on the left still occur in time before the points on the right, but the chart doesn’t say anything else on how the progress relates to the time scale. No hint of linearity or determinism.
The updated knowledge discovery process diagram now looks like this.


This is so n times better than the […]famous “Cone of Uncertainty” (http://samples.leanpub.com/leprechauns-sample.pdf).