
I’m continuing reporting my impressions from the 2012 Lean Systems Society Conference that took place in Boston last week. The start of my report is in these two posts: Batch 1 and Batch 2.
Benjamin Mitchell: What Comes After Visualizing the Work? Conversations for Double Loop Changes in Mindset One important takeaway here was the Ladder of Inference. The five rungs of this ladder are: select, describe, explain, evaluate, propose action. A conversation of two people at the top rungs of their respective ladders of inference is basically a shouting match – they propose competing actions without understanding or discussion the underlying reasons residing on the lower rungs. It is important to keep this concept in mind, realize what you or your partner in conversation may be inferring and ask questions that help climb down the ladder to unwind disagreements.
Benjamin also used several examples to reinforce double-loop learning. “Visualization alone doesn’t address systemic problems underlying people’s behaviors,” he said. He gave an example where the WIP limit was 2, but the column had 3 cards. After the limit was increased to 3, the column soon had 4 cards. Instead of teaching practices and behaviours, we need to effect changes in mindset from which the future actions will follow.
Mike Burrows: Who Moved My Risk?
Coming to this session, I was prepared to hear about using WIP limits to transfer information upstream to enable better risk management, using classes of service to manage risk, and visualizing the risk information inherent in different work item types. Mike indeed said during the session, “Making different types of work visible is the killer feature of Kanban.”
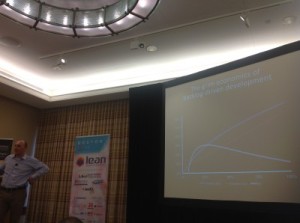
But the biggest highlight of this session for me was Mike’s inquiry into the flip side of risk — the declining ROI. Mike coined an awesome term — backlog-driven development and explored the grim economics of it. It turns out this is a classic U-curve optimization. Now, dear reader, please refer to the Principles E6 and E7 in Donald Reinertsen’s The Principles of Product Development Flow – the ROI is relatively insensitive to the backlog size near the maximum – so the conclusion is to shrink the backlog to reduce risk and improve mutual understanding.
Mike has also blogged about his session and his slides are available on Slideshare.
Markus Andrezak and Arne Roock: Are You Sure You’re Doing Project Work?
Almost immediately, Markus and Arne (both were nominated for the Brickell Key award and Arne went on to win it) presented the same U-curve analysis of the optimal batch size in projects.
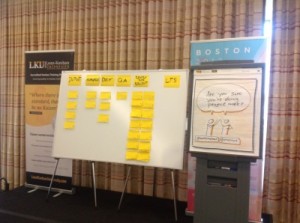
As you can see on the board at the start of their session, there is a large-batch transfer at the end of the project. The cards (user stories) flow pretty well through the engineering phases (development and testing) but then get bogged down in the downstream deployment steps. This is a common situation in many software development organization and was a recurring theme in the open space and many conversations in the conference lobby. The convenient approach taken by many project managers is to let work items pool in those downstream steps — we will eventually deploy all of them by the end of the project, so what difference does it make?
First, Markus and Arne debunked that “wisdom” with the U-curve batch size analysis. Second, and this was also a recurring theme in several conversations, limiting the output queue shortens the cycle time, which in turn enables better decisions on what to select into the input queue. “Output and mid-stream development queues are about doing wrong things better, but the input queue is about doing the right things right.” Markus has blogged about this session already, giving more detail and there is more about it in the conference proceedings.
I also left with the impression that the question in this session title was rhetorical and that project is really just a fancy term for a large-batch transfer to the downstream partner. Running projects this way always has an implicit assumption that the partner can ingest a batch of the certain size into their own value stream and not choke on it, but this assumption is more often false than it is true.
I am not done yet! Stay tuned for more reporting.


Nice post. Thanks for the write up. I’m interested in what the labels are on the axis of Mike Burrows graph… Do you know?
Jon, the axis labels on Mike Burrows’ graph are percentages: the vertical axis is the ROI and the horizontal axis is the percentage of the original backlog delivered to completion.
Pingback: LSSC’12 Report: The Lean Camp | Learning Agile and Lean
Pingback: LSSC’12 Report Wrap-up | Learning Agile and Lean