This post is about one of the key measurements of flow we use in Kanban: lead time. We’ll talk a bit about how to measure it and analyze and use the results.
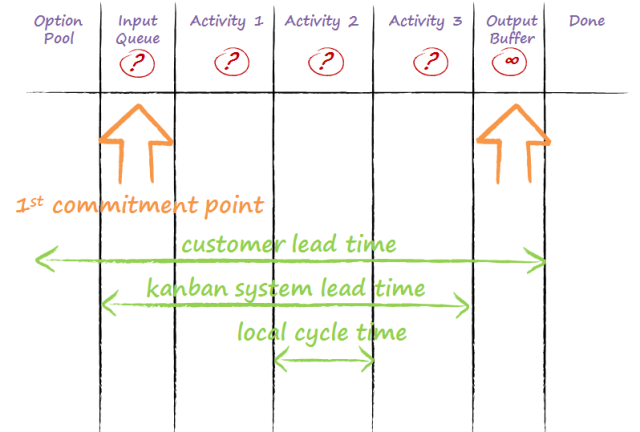
Loosely defined, the lead time is how long it takes a work item to get through the system. There are several variations of this definition. The customer lead time is essentially from concept to cash. In non-manufacturing, knowledge-work kanban systems, we also use the kanban system lead time, measured from the kanban system’s first commitment point to the first infinite buffer.
We also use the term cycle time. In knowledge-work kanban systems, it is always local and qualified where it is to and from. There is no “the cycle time.” There are interesting reasons behind these definitions, but they are beyond the scope of this post.

Example: a policy card on a Kanban board with a reminder to mark lead time
Measuring lead time is very easy. All it takes is to note when the work item started, when it was delivered, and subtract the difference. We can do this using timestamps from electronic work management systems. If we use physical Kanban boards, we can also do this by marking the start and end dates in the bottom corners of the card. The “Robinson Crusoe method”, placing a mark on the card every day, proved ineffective in the modern office.
After delivering several items, we’ve got a lead time data set. We can now plot a histogram and analyze the distribution
Example
Here is an example of lead time distributions from an organization developing custom IT solutions.
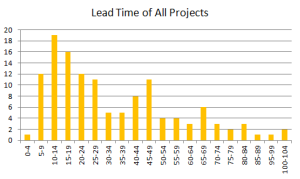
This is not an uncommon lead time distribution shape, with a left-shifted asymmetric “hump” and a long, fat “tail.” The best fit for this data set is the so-called Weibull distribution with the shape parameter 1.62. (Weibull is a parametrized family of distributions. Varying the shape parameter tweaks the distribution curve into several distinct shapes. But this is a topic for another post.)
The delivery takes 34 days on average. Eighty-five percent of solutions are delivered in 61 days, 98% take up to 96 days. We know these probabilities if we know nothing else about a project.
Drilling Down
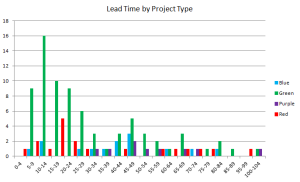
This organization’s projects are not all the same. They deliver solutions of several different types. The following histogram shows the lead time distribution of four major project types. (For reasons of anonymity, these project types are only identified by colour-coding.)
We can see on this chart that each project category has a different distribution. Blue implementations typically take longer to deliver than green projects. There are several, disproportionally too many red reports in the distribution’s tail, even though their distribution peak is left-shifted. Purple integrations take quite a long time even in the best case.
The first bits of information known about a project is which of the categories it falls into. In Kanban, we call these work item types. This information is clear, unambiguous, and requires no time or effort to get. Let’s drill down our lead time data set by work item type.
Here is the lead time histogram for “green” projects which account for a bit more than half of all deliveries.
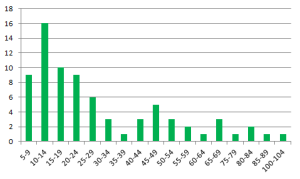
Green projects are delivered slightly faster than the average for all projects, in 30 days vs. 34. The 85th percentile of deliveries also take less time, 54 days vs. 61; and the 98th percentile takes 85 days vs. 96.
The best distribution fit for green projects is, again, Weibull with shape 1.62. One important quality of this distribution is that the percentiles (the 85th, the 98th and others) depend only on the average and the shape parameter. Anyone can calculate the average. Finding the shape parameter takes some statistical skill, but the good news is, it doesn’t change much with time. (I plan to write later about simpler ways to find the shape parameter with sufficient precision.) Knowing the shape parameter and the average, we can calculate the 85th, the 98th and any other percentile we need. We can also, of course, take these percentiles from the data set.
Let’s now take a look at red reports.
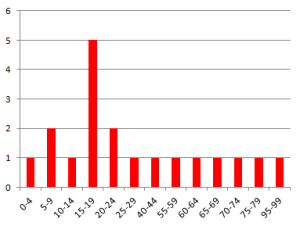
The delivery process company uses for this type of project is different and this shows in the shape parameter of the best-fit distribution. It is again Weibull, but the shape parameter is much smaller: 1.23. The average delivery takes 35 days, the mode (most common lead time ) is much less, 85% of deliveries take 61 days, 98% take 96 days.
Looking at other work item types, blue implementation projects follow a distribution similar to green projects: shape parameter 1.65, average 40 days, 85% delivered in 66 days, 98% in 81 days.
The organization’s process for delivering purple integration projects is the most regimented and uses several phase gates. This is also reflected in the lead time distribution shape (shape parameter: 3.22). It is more symmetrical, with very few “small” (short lead-time) projects. The average delivery time is 56 days, 85% in 70 days, 98% in 100 days.
Establishing Service-Level Expectations
We can now establish service level expectations for different work item types delivered by this organization. The following table summarizes data for four work item types. For the sake of comparison, I included percentile estimates obtained using parametrized distributions. (A little secret: I have “navigation tables” with pre-calculated ratios for all common distribution shapes, so I simply took the average lead time and multiplied it by numbers from the table using my phone’s calculator).
| Work item type | Shape | Average lead time | From the lead time data set | From the parametrized distribution | ||
| 85% | 98% | 85% | 98% | |||
| Green Projects | 1.62 | 30 | 54 | 85 | 51 | 83 |
| Red Reports | 1.23 | 35 | 61 | 96 | 63 | 112 |
| Blue Implementations | 1.65 | 40 | 66 | 81 | 68 | 110 |
| Purple Integrations | 3.22 | 56 | 70 | 100 | 78 | 99 |
Notice that the 98th-percentile estimates obtained using parametric distributions are fairly conservative. This is appropriate as small data sets (there were only 19 Red and 14 Blue work items in the data set) don’t capture probabilities of rare events well.
Summary
Lead time is easy to measure. There are several definitions and it’s important to understand where to measure from and to. Many services deliver a mix of work item types. Therefore it is important to drill down our lead time data by work item type, so that separate service level expectations can be established for each. Properties of common lead-time distributions are well-studied and can be used to support the SLEs and forecasting.




Pingback: Inside a Lead Time Distribution | Connected Knowledge
Pingback: Внутри распределения времени выполнения
Pingback: Анализ диаграммы распределения времени выполнения заказа | Kanban Russia
Pingback: Внутри распределения времени выполнения | Kanban Russia