
I’m introducing a simple tool: lead time forecasting cards.
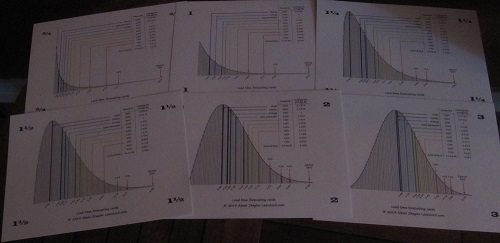
Each card displays a pre-calculated distribution shape, using Weibull distribution with shape parameters 0.75, 1 (Exponential distribution), 1.25, 1.5, 2 (Rayleigh distribution), and 3. (Since I printed the first batch, I realized I need to include k=0.5 in the collection.)
For each distribution, the following points are marked with rainbow colours:
- mode
- median
- average
- percentiles (63rd, 75th, 80th, 85th, 90th, 95th, 98th, and 99th)
- the upper control limit (99.865%)
The scale of each card is such that the lead time average is 1. Your average is different, so multiply it by the numbers given in the table on each card.
I will be bringing a small number of printed cards to the upcoming conferences, training classes and consulting clients. The goal is, of course, to get feedback, refine them, and then make them more widely available.


Pingback: Lead Time and Iterative Software Development | Connected Knowledge